LangSmith vs Langfuse vs Arize Phoenix: LLM Observability in 2026
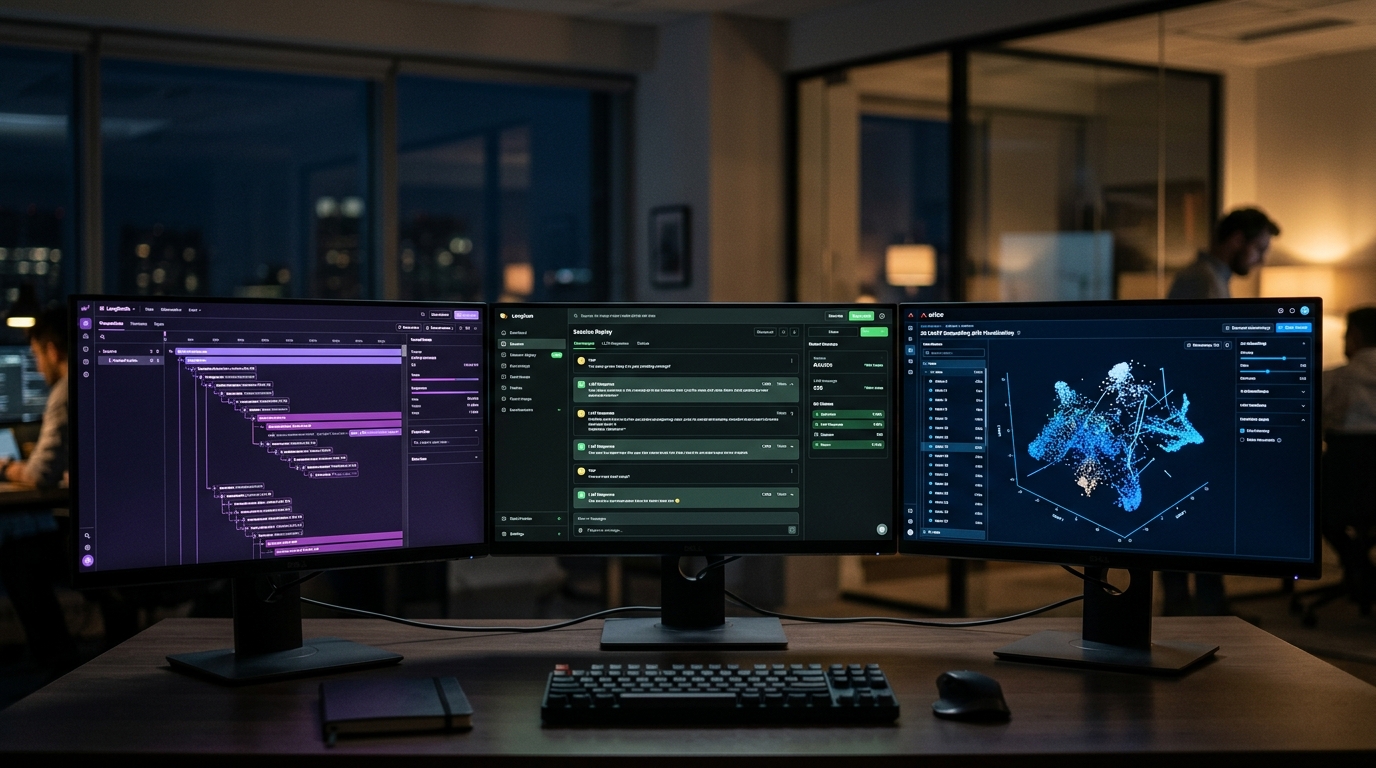
We've run all three in production. Here's a clear comparison of LangSmith, Langfuse, and Arize Phoenix — pricing, strengths, and which one to pick for your stack.
We’ve run all three — LangSmith, Langfuse, and Arize Phoenix — across different production AI deployments: a customer-facing RAG pipeline doing ~50k LLM calls/day, an internal multi-agent workflow orchestrating legal document review, and a batch evaluation harness scoring 100k+ trajectories for a model upgrade.
The market has consolidated. The “try five proprietary SDKs” era is over. Langfuse and Phoenix standardized on OpenTelemetry. LangSmith added OTel ingestion but remains tightly coupled to the LangChain ecosystem. Arize’s strength in drift detection and RAG evaluation hasn’t shifted. Here’s where each tool actually wins in 2026, what each one costs at scale, and our recommendation for different team profiles.
What LLM Observability Means Now
Traditional APM tools (Datadog, New Relic, Honeycomb) track request latency, error rates, and resource utilization. That’s necessary and insufficient for LLM workloads.
LLM observability adds three dimensions these tools were never built for:
- Semantic correctness — an HTTP 200 can return a confident hallucination
- Token-level cost attribution — a single user session can cost $0.42 or $42 depending on model routing
- Nested agent tracing — agents spawn sub-agent calls, tool invocations, and retrieval steps that branch and rejoin, requiring tree span structures, not flat request logs
The closed loop that matters now: trace → evaluate → collect datasets → improve prompts → redeploy. Tools that cover only one piece of that loop are losing ground.
LangSmith: LangChain-Native, But Paying for the Privilege
Best for: Teams already using LangChain/LangGraph who want the tightest possible integration between tracing, evals, and prompt iteration.
LangSmith is LangChain’s observability platform, and it shows. The trace UI renders LangGraph checkpoint states natively — you can see exactly which node ran, what state it mutated, and why a router chose a particular path. The prompt playground lets you A/B test prompt variants and commit winners to a dataset. Their “Fleet” product (launched late 2025) even deploys agents directly from the platform.
But there are real trade-offs:
- Vendor lock-in: The instrumentation SDK is LangChain-centric. If you’re using the OpenAI Agents SDK, CrewAI, or raw OTel spans, you lose a lot of the value props
- Proprietary: No self-hosted option. You’re sending all your prompt data and traces to LangChain’s infrastructure
- Pricing at scale: Free tier covers 50k traces but paid tiers scale with event volume. At 500k+ traces/month, you’re looking at the Enterprise plan — custom pricing that starts high
LangSmith’s evaluation features are genuinely strong. Their built-in LLM-as-judge evaluators, criteria templates, and dataset comparison workflows are polished. The trade-off is that you’re buying into the LangChain ecosystem in a way that goes beyond a simple tracing relationship.
When to pick it: You’re all-in on LangChain/LangGraph, your team doesn’t have strong opinions about data sovereignty, and you want the most integrated dev-to-prod experience available.
Langfuse: Open-Source, Self-Hosted, and the Community Standard
Best for: Teams that want framework-agnostic tracing with self-hosting, or anyone running in regulated environments where data can’t leave your infrastructure.
Langfuse has emerged as the community default for a reason:
- MIT license, fully self-hostable: The core product is free. Run it on a ClickHouse cluster and you own the data pipeline end-to-end
- Acquired by ClickHouse (January 2026): This matters — it means Langfuse now has the analytics database company behind it, and the ClickHouse integration gives it native high-performance trace storage. The long-term risk: the roadmap is now influenced by a database vendor, not a pure observability company
- Framework agnostic: Native SDKs for LangChain, LlamaIndex, OpenAI, LiteLLM, and raw OTel. Doesn’t care what you’re building with
- Session replays: Reconstruct conversation histories with full trace trees. Critical when a user reports “the bot gave a weird answer at some point yesterday”
- Evaluator templates: Built-in hallucination detection, toxicity scoring, and context relevancy evals — run them on live traces or batch datasets
The free tier (50k events/month on Langfuse Cloud) is generous enough for most startups. Self-hosted means unlimited events at infrastructure cost, which for 2–3M traces/month on a modest ClickHouse setup runs under $500/month in compute.
The UI is clean but less polished than LangSmith’s. Dataset management and prompt versioning exist but don’t have the same level of integration. If you’re iterating on prompts daily, LangSmith still has the edge.
When to pick it: You need self-hosting, you’re framework-agnostic or use multiple frameworks, or you have compliance requirements around data residency. This is our default pick for enterprise deployments.
Arize Phoenix: Best for RAG Evaluation and Drift Detection
Best for: Teams running RAG pipelines who need to catch retrieval quality degradation and embedding drift before users notice.
Arize Phoenix is the open-source sibling of Arize AI’s commercial platform. It takes a fundamentally different approach from LangSmith and Langfuse:
- Evaluation-first, not trace-first: Phoenix is built around eval workflows. Pre-built templates for RAG quality (context precision, faithfulness, answer relevance), toxicity, and groundedness
- UMAP embedding visualization: See your retrieval data projected in 2D. Drift is immediately visible — when new documents land outside the trained embedding distribution, it shows up as a new cluster. This is Phoenix’s killer feature and nothing else really competes here in the open-source space
- Notebook-native: Designed to run in Jupyter for development, then production traces feed back in. The workflow is: eval in notebook → deploy → monitor drift → rerun eval
- Apache 2.0 license: Fully permissive. 9,000+ GitHub stars as of early 2026
Phoenix’s trace viewer is functional but not as good as Langfuse’s session replay. It doesn’t have the same prompt management capabilities as either competitor. But if your problem is specifically “is our RAG pipeline getting worse over time,” Phoenix is the right tool.
We’ve used it to catch embedding model regressions that would have gone undetected in standard latency/cost monitoring — the retrieval was fast and cheap, but the semantic recall had degraded by 30% after an index rebuild. Phoenix’s UMAP plots showed it in five minutes.
When to pick it: RAG is your core product, embedding drift is a real business risk, or you need production-grade eval workflows more than real-time trace replay.
Feature Comparison Matrix
| Capability | LangSmith | Langfuse | Arize Phoenix |
|---|---|---|---|
| License | Proprietary | MIT | Apache 2.0 |
| Self-hosted | No | Yes | Yes |
| LangChain integration | Native (deepest) | Native SDK | SDK-based |
| OTel support | OTel ingestion | Native OTel | Native OTel (OpenInference) |
| Session replay | Yes | Yes (cleanest) | Basic |
| Prompt management | Best-in-class | Good | Limited |
| RAG evals | Via LLM-as-judge | Evaluator templates | Best-in-class |
| Drift detection | Manual | Manual | Visual (UMAP, statistical) |
| Dataset workflows | Excellent | Good | Excellent |
| Cost at 500k traces/mo | Enterprise tier | Self-host: ~$500 infra | Self-host: ~$500 infra |
| Multi-agent trace view | Excellent (LangGraph-aware) | Good | Functional |
The Verdict: Pick Based on Your Architecture, Not the Marketing
The LLM observability market has settled into three clear positions:
- LangSmith for LangGraph-heavy teams who want a single platform from dev to deploy
- Langfuse for everyone else — self-hosted, framework-agnostic, and the one with the widest community adoption
- Phoenix for RAG-first teams where retrieval quality is the primary business risk
A common pattern we see in production: teams start with LangSmith (because it’s the default with LangChain), then migrate to Langfuse as they adopt non-LangChain frameworks or hit data residency requirements. The migration is straightforward — OTel ingestion on both sides.
The tool we recommend most teams start with: Langfuse, self-hosted or cloud. It’s the only one that doesn’t constrain your next architectural decision. Add Phoenix alongside if RAG quality is a critical SLO.
What We’re Tracking Next
- Langfuse + ClickHouse integration: How will the ClickHouse acquisition reshape the open-source roadmap? Early signs point to better multi-tenant deployments and a managed tier aimed at mid-market
- OpenTelemetry GenAI conventions: As these stabilize, the differentiation between OTel-native tools should narrow. The remaining moat is UI and eval quality
- Evaluation automation: Phoenix and Langfuse are both pushing toward automated eval pipelines. The team that nails “deploy only if evals pass” wins the CI/CD moment for AI
For a deeper look at how to wire up tracing with OpenTelemetry regardless of which backend you choose, see our OTel tracing guide. For setting up the eval side of the loop, our model evals in production post covers the patterns. And for the broader infrastructure picture — where observability fits in the full stack — check our AI infrastructure stack.
We design, deploy, and operate custom AI agent systems for companies that need them to work. Let’s talk.
Related Posts

Instrument OpenAI Agents with Langfuse: Full Observability Tutorial
Trace every tool call, guardrail check, and handoff in your OpenAI Agents SDK app with Langfuse. Working code, no fluff.

AI's Infrastructure Gap: Why 88% of Pilots Fail
79% of companies are adopting AI agents. Only 2% run them at scale. The bottleneck isn't models — it's the infrastructure underneath.

Tracing LLM Applications with OpenTelemetry
OpenTelemetry's GenAI semantic conventions let you trace LLM applications with the same standards as the rest of your stack. A practical guide to instrumenting agents, tool calls, and retrieval with OTel.